一、安装Logstash
1.解压tar包
1 2 | cd /data/app/elk/elk-6.8.5tar zxvf logstash-6.8.5.tar.gz |
2.配置config目录下的logstash.conf
1 2 3 4 5 6 7 8 9 10 11 12 13 14 15 16 17 18 19 20 21 22 23 24 25 26 27 28 29 30 31 32 33 34 35 36 37 38 39 40 41 42 43 44 45 46 47 48 49 50 51 52 53 54 55 56 57 58 59 60 61 62 63 64 65 66 67 68 69 70 71 72 73 74 75 76 77 78 79 80 81 82 83 84 | # 数据输入部分input { # 读取nginx访问日志 file { #path:监听文件的路径,绝对路径 path => "/data/app/nginx/logs/access.log" #为Nginx的access.log路径 # 格式:json codec => "json" #start_position:监听文件的起始位置,beginning:从文件的头开始读取 start_position => "beginning" #type:自定义类型 type => "nginx-access-log" } # 读取nginx异常日志 file { path => "/data/app/nginx/logs/error.log" #为Nginx的error.log路径 # 格式:plain,输入的是字符串,输出把全部内容放到message字段 codec => "plain" start_position => "beginning" type => "nginx-error-log" } #filebeats方式 beats { port => 5044 type => "beats_log" } #自定义端口,一个项目可对应一个自定义tcp端口接收数据 tcp { mode => "server" host => "192.168.X.X" #IP地址 port => 21022 codec => json type => "application-log" #application一般为项目名称 }}# 数据处理部分filter{ if[type] == "application-log"{ mutate { rename => {"host" => "hostname"} } }}# 数据输出部分output { # beat监控信息 if [type] == "beats_log"{ elasticsearch { hosts => ["192.168.X.X:9200"] manage_template => false index => "%{[@metadata][beat]}-%{[@metadata][version]}-%{+YYYY.MM.dd}" user => "elastic" password => "elastic2021" } } # nginx访问日志 if[type] == "nginx-access-log" { elasticsearch { hosts => ["192.168.X.X:9200"] index => "nginx-access-log-%{+YYYY.MM.dd}" # elasticsearch的用户名、密码 user => "elastic" password => "elastic2021" } } # nginx异常日志 if[type] == "nginx-error-log"{ elasticsearch{ hosts => ["192.168.X.X:9200"] index => "nginx-error-log-%{+YYYY.MM.dd}" user => "elastic" password => "elastic2021" } } # 应用系统日志 if[type] == "application-log"{ elasticsearch { hosts => ["192.168.X.X:9200"] index => "application-log-%{+YYYY.MM.dd}" user => "elastic" password => "elastic2021" } }} |
3.启动命令
1 2 | cd /data/app/elk/elk-6.8.5/logstash-6.8.5nohup ./bin/logstash -f config/logstash.conf & |
4.查看Logstash是否启动成功
1 | ps -ef | grep logstash |
二、配置应用项目的logback环境
1.在pom.xml中添加Logstash依赖
1 | net.logstash.logbacklogstash-logback-encoder6.2 |
2.在resouces目录下添加logback-spring.xml
1 2 3 4 5 6 7 8 9 10 11 12 13 14 | 192.168.X.X:21021UTC { "severity": "%level", "service": "${APP_NAME:-}", "trace": "%X{X-B3-TraceId:-}", "span": "%X{X-B3-SpanId:-}", "parent": "%X{X-B3-ParentSpanId:-}", "exportable": "%X{X-Span-Export:-}", "pid": "${PID:-}", "thread": "%thread", "class": "%logger", "rest": "%message" } |
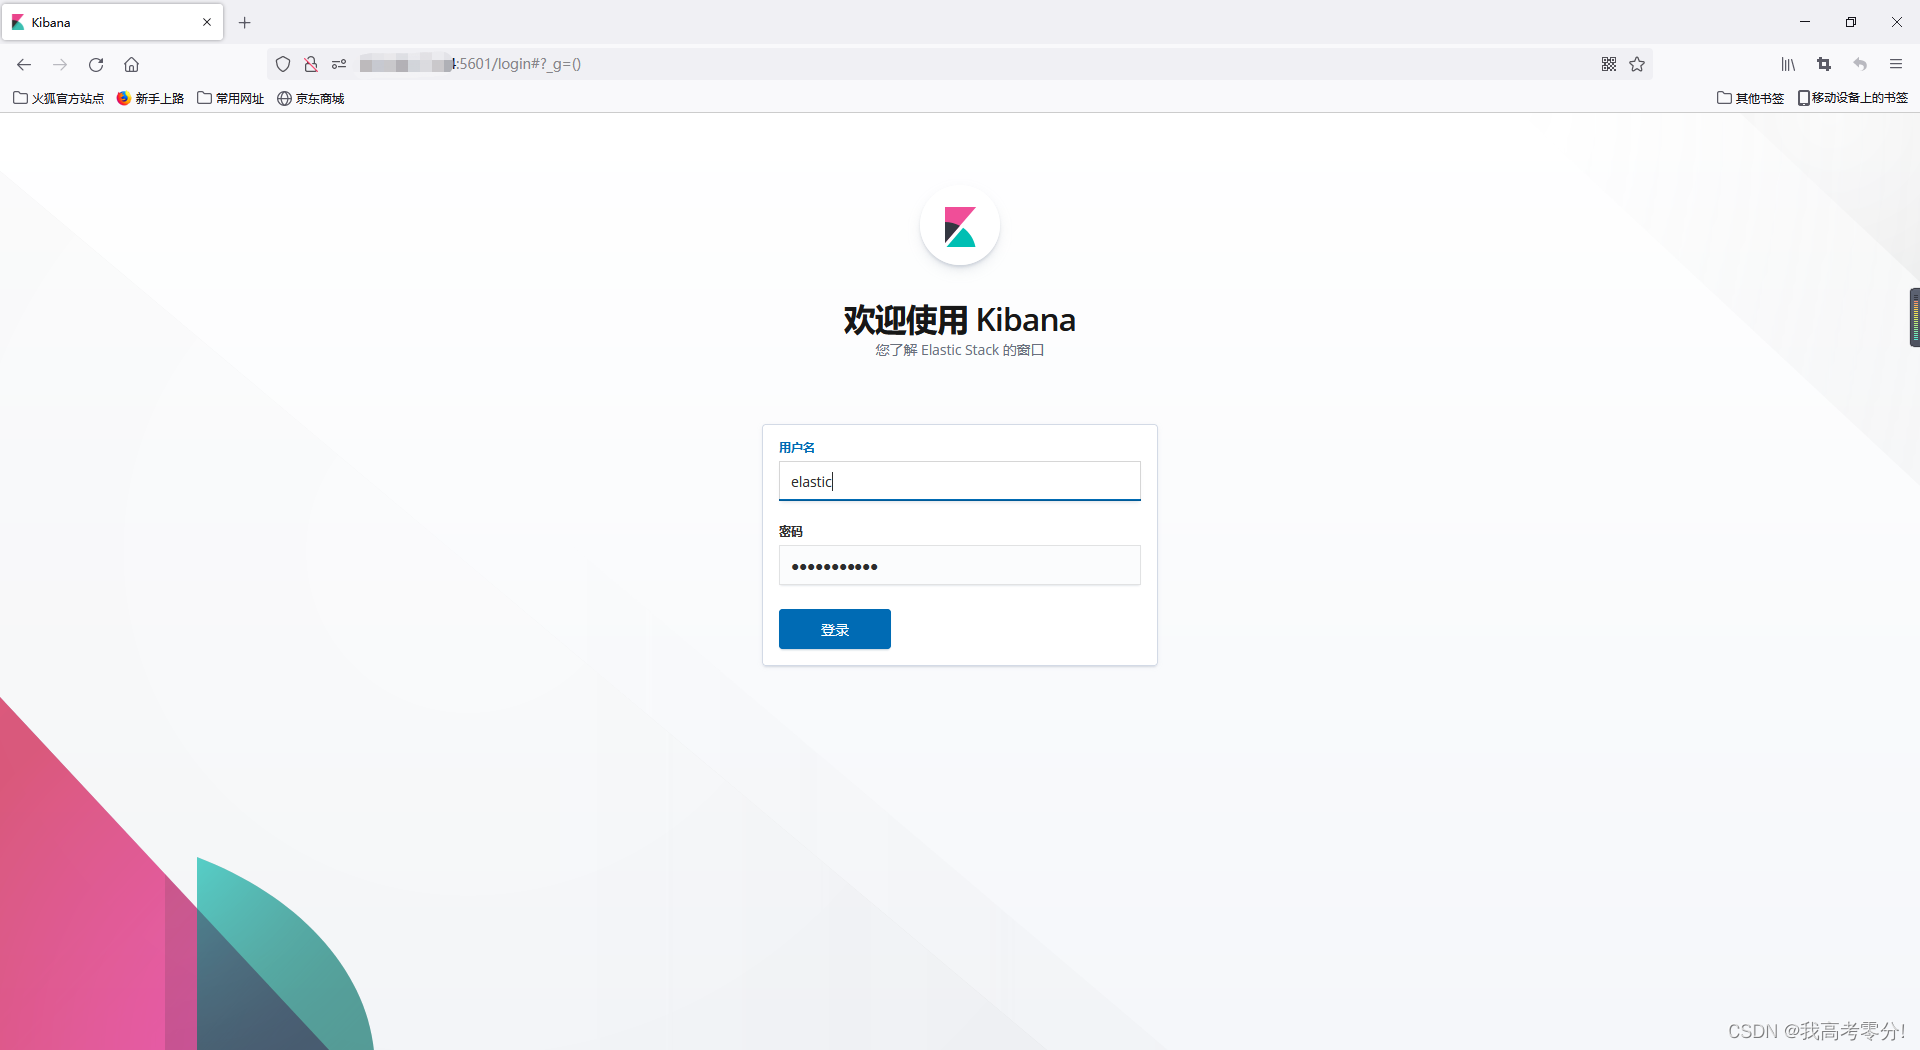
三、在kibana界面查看数据
浏览器访问192.168.X.X:5601
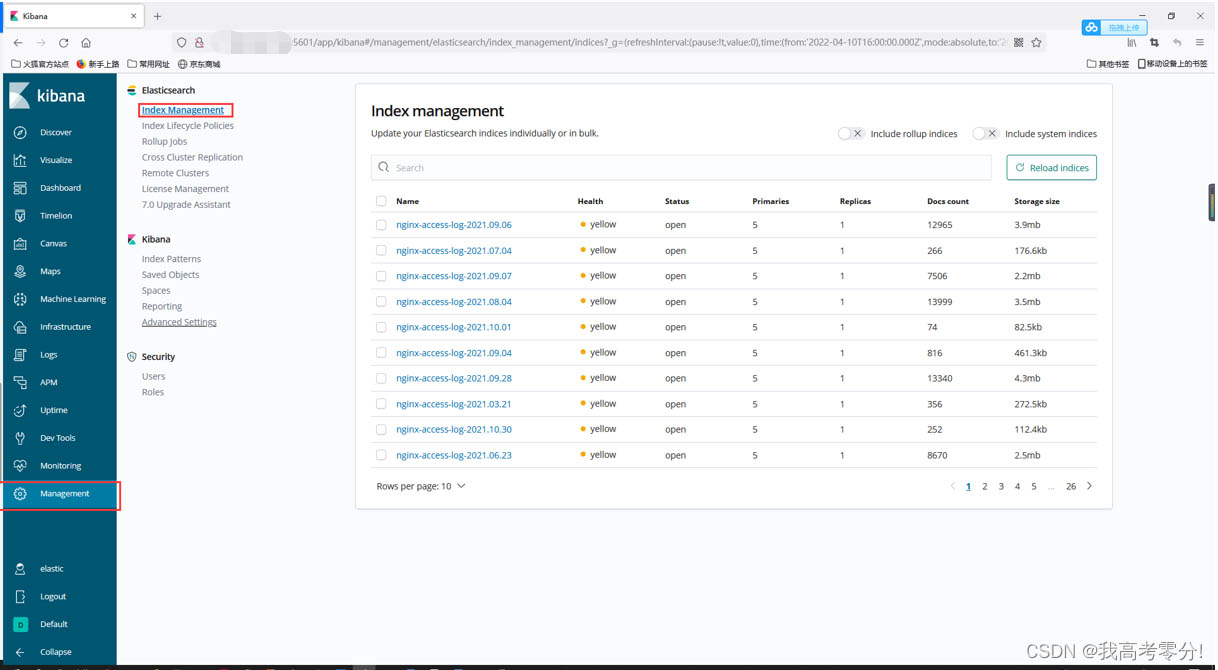
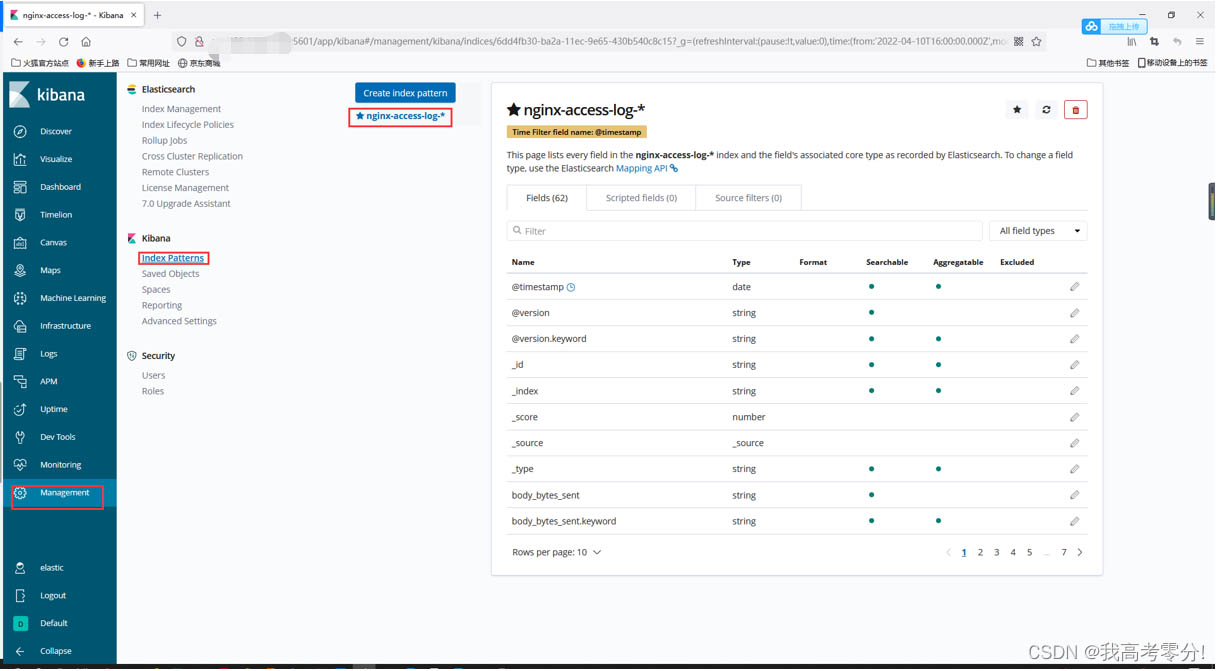
1.查看索引管理
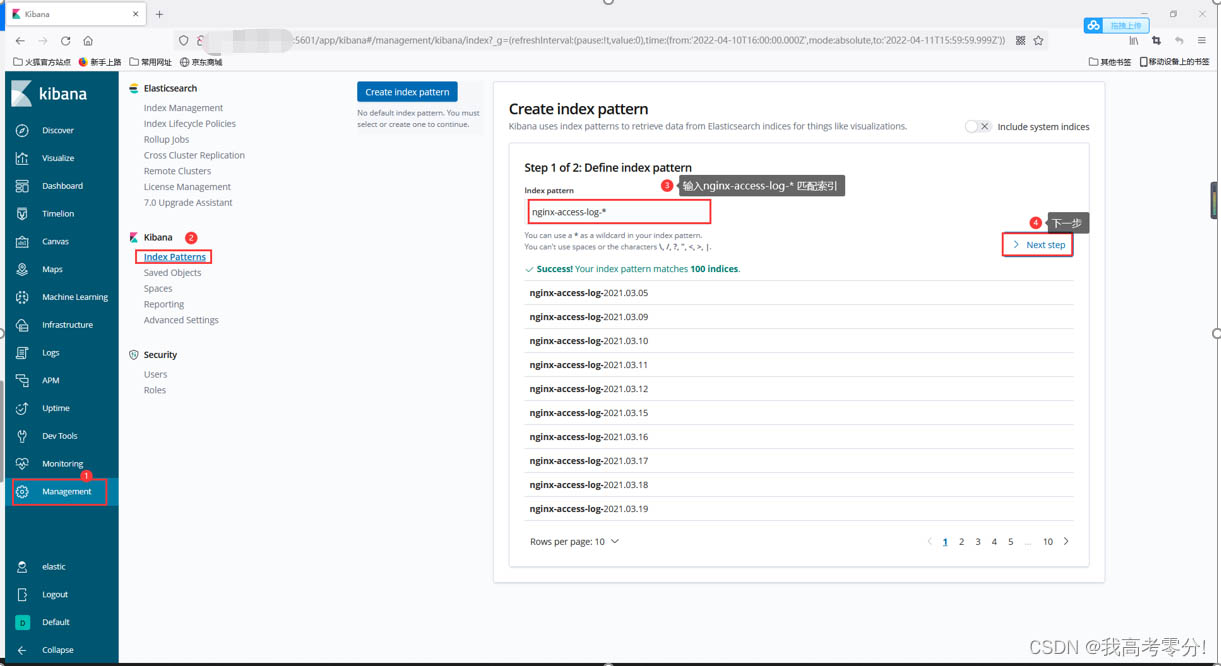
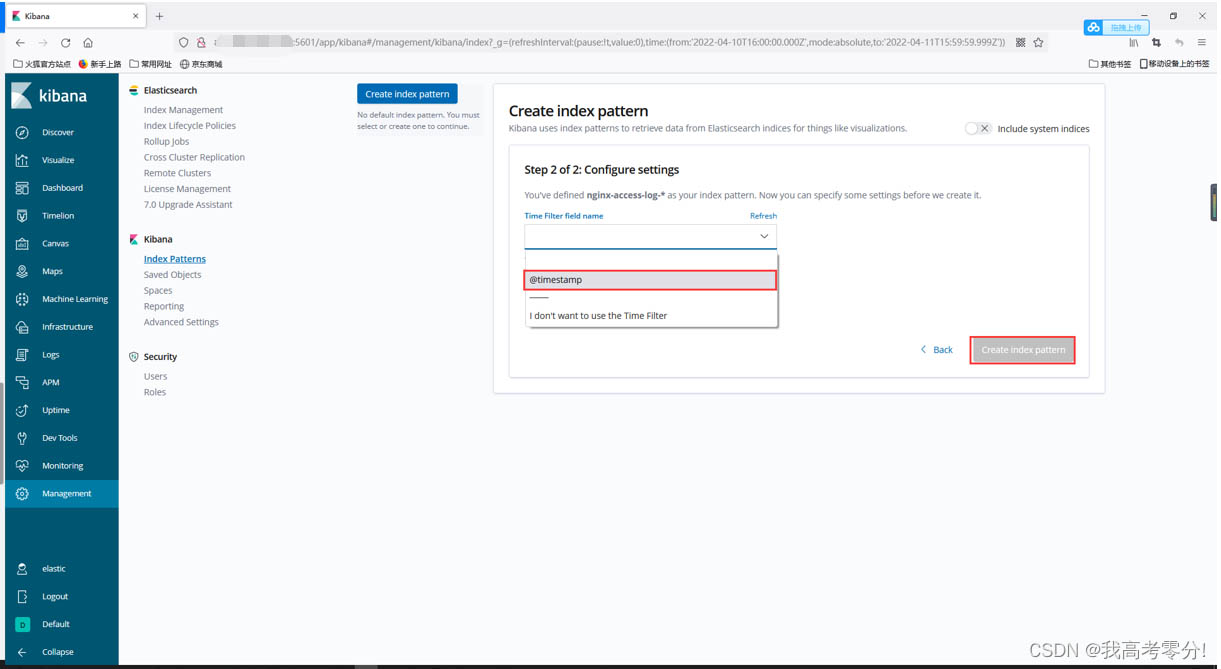
2.配置索引模式
总结
以上为个人经验,希望能给大家一个参考,也希望大家多多支持IT俱乐部。