matplotlib及相关cmap参数的取值
在matplotlib中对于图片的显示有如下方法(这不是重点), 其中有cmap=‘binary’的参数。
1 2 3 | plt.imshow(imgs[i].reshape(28, 28), cmap='binary')#或如下:也可以达到相同的效果plt.imshow(imgs[i].reshape(28, 28), cmap=plt.get_cmap('binary')) |
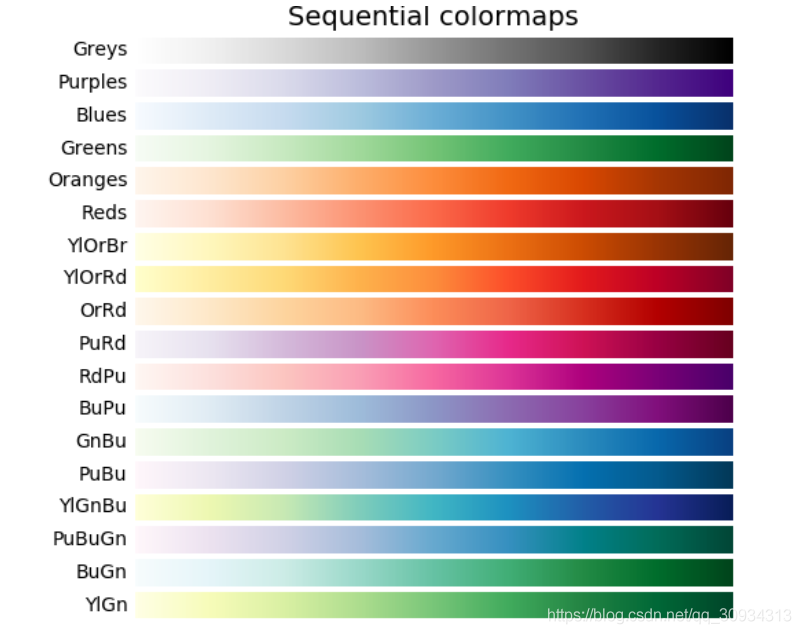
这 是对显示颜色参数的定义,它可以有很多渐变色可以选择:
具体取值详细参见:
https://matplotlib.org/users/colormaps.html
https://matplotlib.org/examples/color/colormaps_reference.html
matplotlib中各种图形参数解释
柱状图bar的使用
1 | matplotlib.pyplot.bar(left, height, alpha=1, width=0.8, color=, edgecolor=, label=, lw=3) |
-
left: x轴的位置序列,一般采用range函数产生一个序列,但是有时候可以是一个字符串 -
height: y轴的数值序列,也就是柱形图的高度,一般就是我们需要显示的数据 -
alpha: 透明度,值越小越透明 -
width: 为柱形图的宽度,一般是0.8就行 -
color或facecolor: 柱形图填充的颜色 -
edgecolor: 图形边缘颜色 -
label: 解释每个图像代表的含义,这个参数是为legend()函数做铺垫的,表示该次bar的标签。 -
linewidth or linewidths or lw: 边缘or线的宽
散点图scatter的使用
1 | plt.scatter(x, y, s=20, c=None, marker=‘o', cmap=None, norm=None, alpha=None, linewidths=None, edgecolors=None |
-
x: 指定散点图的x轴数据 -
y: 指定散点图的y轴数据 -
s: 指定散点图点的大小,默认为20,通过新传入的变量,实现气泡图的绘制 -
c: 指定散点图点的颜色,默认为蓝色 -
marker: 指定散点图点的形状,默认为圆形 -
cmap: 指定色 图,只有当c参数是一个浮点型的数组时才起作用 -
norm: 指定数据亮度, 标准化到0~1之间,使用该参数仍需要c为浮点型的数组 -
vmin、vmax: 亮度设置,与norm类似,如果使用了norm则该参数无效 -
alpha: 设置散点的透明度 -
edgecolors: 设置散点边界线的颜色 -
linewidths: 设置散点边界线的粗细
折线图plot的使用
1 | plt.plot(x, y, color=, linewidth=,linestyle=, label=, marker=,) |
-
x,y: array表示x轴与y轴对应的数据 -
color: 表示折线的颜色 -
marker: 表示这线上数据点处的类型 -
linestyle: 表示折线的类型 -
linewidth: 表示折线的粗细 -
alpha: 表示电的透明度 -
label: 数据图例内容
箱型图boxplot的使用
1 | matplotlib.pyplot.boxplot(x, north=None, sym=None, vert=None, whis=None, positions=None, widths=None, patch_artist=None, meanline=None, showmeans=None, showcaps=None, showbox=None, showfliers=None, boxprops=None, labels=None, filerprops=None, medianprops=None, meanprops=None, capprops=None, whiskerprops=None) |
-
x: 指定要绘制箱型图的数据 -
north: 是否是凹凸的形式展现箱线图,默认非凹凸 -
sym: 指定异常点的形状,默认为+号表示 -
vert: 是否需要将箱线图垂直摆放,默认垂直摆放 -
whis: 指定上下须与上下四分位的距离,默认为1.5倍的四分位差 -
positions: 指定箱线图的位置,默认为[0, 1, 2,…] -
widths: 指定箱线图的宽度,默认为0.5 -
patch_artist: 是否填充箱体的颜色 -
meanline: 是否用线的形式表示均值,默认用点来表示 -
showmeans: 是否显示均值,默认不显示 -
showcaps: 是否显示箱线图顶端和末端的两条线,默认显示 -
showfliers: 是否显示异常值,默认显示 -
boxprops: 设置箱体的属性,如边框色、填充色等 -
labels: 为箱线图添加标签,类似于图例的使用 -
filerprops: 设置异常值的属性,如异常点的形状、大小、填充色等 -
medianprops: 设置中位数的属性,如线的类型、粗细等 -
meanprops: 设置均值的属性,如点的大小、颜色等 -
capprops: 设置箱线图顶端和末端线条的属性,如颜色、粗细等 -
whiskerprops: 设置须的属性,如颜色、粗细、线的类型等。
饼图pie的使用
1 | matplotlib.pyplot.pie(x, explode=None, labels=None, colors=None, autopct=None, pctdistance=0.6, shadow=False, labeldistance=1.1, startangle=None, radius=None, counterclock=True, wedgeprops=None, textprops=None, center=(0, 0), frame=False) |
-
x: 指定绘图的数据 -
explode: 指定饼图某些部分的突出显示,即呈现爆炸式 -
labels: 为饼图添加标签说明,类似于图例说明 -
colors: 指定饼图的填充色 -
autopct: 自动添加百分比显示,可以采用格式化的方法显示 -
pctdistance: 设置百分比标签与圆心的距离 -
shadow: 是否添加饼图的阴影效果 -
labeldistance: 设置各扇形标签(图例)与圆心的距离 -
startangle: 设置饼图的初始摆放角度 -
radius: 设置饼图的半径大小 -
counterclock: 是否让饼图按逆时针顺序呈现 -
wedgeprops: 设置饼图中文本的属性,如字体大小、颜色等 -
center: 指定饼图的中心点位置,默认为原点 -
frame: 是否要显示饼图背后的图框,如果设置为True的话,需要同时控制图框x轴、y轴的范围和饼图的中心位置。
以上为个人经验,希望能给大家一个参考,也希望大家多多支持IT俱乐部。