一.redis-shake v4
1.镜像
######################### Dockerfile ########################################
FROM centos:7

WORKDIR /opt
COPY shake.toml /tmp/
COPY redis-shake /opt/
COPY entrypoint.sh /usr/local/bin/
RUN  chmod +x redis-shake  &&  chmod +x /usr/local/bin/entrypoint.sh
EXPOSE 8888
ENTRYPOINT ["entrypoint.sh"]

######################### entrypoint.sh ######################################
#!/bin/bash
set -e

eval "cat  /opt/shake.toml
/opt/redis-shake /opt/shake.toml
exit 0
2.shake.toml
status_port = 8888 获取监控数据端口,部署启动时映射8888端口
function = ""

########## 过滤key #########################################
#function """
#local prefix = "user:"
#local prefix_len = #prefix
#if string.sub(KEYS[1], 1, prefix_len) ~= prefix then
#  return
#end
#shake.call(DB, ARGV)
#"""

[sync_reader]
cluster = ${SOURCE_IF_CLUSTER}  # set to true if source is a redis cluster
address = ${SOURCE_ADDRESS}     # when cluster is true, set address to one of the cluster node
password = ${SOURCE_PASSWORD}   # keep empty if no authentication is required
sync_rdb = ${SYNC_RDB} # set to false if you don't want to sync rdb true全量同步 false不全量同步
sync_aof = ${SYNC_AOF} # set to false if you don't want to sync aof true 增量同步 false不增量同步
prefer_replica = true # set to true if you want to sync from replica node
dbs = []           # set you want to scan dbs such as [1,5,7], if you don't want to scan all
tls = false
# username = ""              # keep empty if not using ACL
# ksn = false         # set to true to enabled Redis keyspace notifications (KSN) subscription

[redis_writer]
cluster = ${TARGET_IF_CLUSTER}   # set to true if target is a redis cluster
address = ${TARGET_ADDRESS}      # when cluster is true, set address to one of the cluster node
password = ${TARGET_PASSWORD}    # keep empty if no authentication is required
tls = false
off_reply = false       # ture off the server reply
# username = ""         # keep empty if not using ACL

[advanced]
dir = "data"
ncpu = 0        # runtime.GOMAXPROCS, 0 means use runtime.NumCPU() cpu cores
# pprof_port = 8856  # pprof port, 0 means disable
status_port = 8888 # status port, 0 means disable

# log
log_file = "shake.log"
log_level = "info"     # debug, info or warn
log_interval = 5       # in seconds

# redis-shake gets key and value from rdb file, and uses RESTORE command to
# create the key in target redis. Redis RESTORE will return a "Target key name
# is busy" error when key already exists. You can use this configuration item
# to change the default behavior of restore:
# panic:   redis-shake will stop when meet "Target key name is busy" error.
# rewrite: redis-shake will replace the key with new value.
# ignore:  redis-shake will skip restore the key when meet "Target key name is busy" error.
rdb_restore_command_behavior = ${RESTORE_BEHAVIOR} # panic, rewrite or ignore

# redis-shake uses pipeline to improve sending performance.
# This item limits the maximum number of commands in a pipeline.
pipeline_count_limit = 1024

# Client query buffers accumulate new commands. They are limited to a fixed
# amount by default. This amount is normally 1gb.
target_redis_client_max_querybuf_len = 1024_000_000

# In the Redis protocol, bulk requests, that are, elements representing single
# strings, are normally limited to 512 mb.
target_redis_proto_max_bulk_len = 512_000_000

# If the source is Elasticache or MemoryDB, you can set this item.
aws_psync = "" # example: aws_psync = "10.0.0.1:6379@nmfu2sl5osync,10.0.0.1:6379@xhma21xfkssync"

# destination will delete itself entire database before fetching files
# from source during full synchronization.
# This option is similar redis replicas RDB diskless load option:
#   repl-diskless-load on-empty-db
empty_db_before_sync = false

[module]
# The data format for BF.LOADCHUNK is not compatible in different versions. v2.6.3  20603
target_mbbloom_version = 20603
3.启动redis-shake后
可部署多个 redis-shake 10.111.11.12:8888 10.111.11.12:8889 10.111.11.12:8890
{“start_time”:”2024-02-02 16:13:07″,”consistent”:true,”total_entries_count”:{“read_count”:77403368,”read_ops”:0,”write_count”:77403368,”write_ops”:0},”per_cmd_entries_count”:{“APPEND”:{“read_count”:2,”read_ops”:0,”write_count”:2,”write_ops”:0},”DEL”:{“read_count”:5,”read_ops”:0,”write_count”:5,”write_ops”:0},”HMSET”:{“read_count”:2,”read_ops”:0,”write_count”:2,”write_ops”:0},”PEXPIRE”:{“read_count”:8,”read_ops”:0,”write_count”:8,”write_ops”:0},”RESTORE”:{“read_count”:77403341,”read_ops”:0,”write_count”:77403341,”write_ops”:0},”SADD”:{“read_count”:1,”read_ops”:0,”write_count”:1,”write_ops”:0},”SCRIPT-LOAD”:{“read_count”:7,”read_ops”:0,”write_count”:7,”write_ops”:0},”SET”:{“read_count”:2,”read_ops”:0,”write_count”:2,”write_ops”:0}},”reader”:[{“name”:”reader_10.127.11.11_9984″,”address”:”10.127.11.11:9984″,”dir”:”/opt/data/reader_10.172.48.17_9984″,”status”:”syncing aof”,”rdb_file_size_bytes”:867659640,”rdb_file_size_human”:”828 MiB”,”rdb_received_bytes”:867659640,”rdb_received_human”:”828 MiB”,”rdb_sent_bytes”:867659640,”rdb_sent_human”:”828 MiB”,”aof_received_offset”:567794044,”aof_sent_offset”:567794044,”aof_received_bytes”:6614445,”aof_received_human”:”6.3 MiB”},{“name”:”reader_10.127.11.12_9984″,”address”:”10.127.11.12:9984″,”dir”:”/opt/data/reader_10.172.48.16_9984″,”status”:”syncing aof”,”rdb_file_size_bytes”:867824091,”rdb_file_size_human”:”828 MiB”,”rdb_received_bytes”:867824091,”rdb_received_human”:”828 MiB”,”rdb_sent_bytes”:867824091,”rdb_sent_human”:”828 MiB”,”aof_received_offset”:564917306,”aof_sent_offset”:564917306,”aof_received_bytes”:6612502,”aof_received_human”:”6.3 MiB”},{“name”:”reader_10.127.11.13_9984″,”address”:”10.127.11.13:9984″,”dir”:”/opt/data/reader_10.172.48.15_9984″,”status”:”syncing aof”,”rdb_file_size_bytes”:867661773,”rdb_file_size_human”:”828 MiB”,”rdb_received_bytes”:867661773,”rdb_received_human”:”828 MiB”,”rdb_sent_bytes”:867661773,”rdb_sent_human”:”828 MiB”,”aof_received_offset”:562834707,”aof_sent_offset”:562834707,”aof_received_bytes”:6615286,”aof_received_human”:”6.3 MiB”}],”writer”:[{“name”:”writer_10.127.12.11_9984″,”unanswered_bytes”:0,”unanswered_entries”:0},{“name”:”writer_10.127.12.12_9984″,”unanswered_bytes”:0,”unanswered_entries”:0},{“name”:”writer_10.127.12.13_9984″,”unanswered_bytes”:0,”unanswered_entries”:0}]}
二.json-exporter配置
1.Dockerfile
FROM prometheuscommunity/json-exporter:latest

USER root
RUN mkdir -p  /opt
WORKDIR /opt
COPY  config.yml /opt/
2.config.yml
根据上边返回的json数据,制定自己需要的监控模版,部署json-exporter 10.111.11.11:7979
modules:
  default:
    headers:
      X-Dummy: my-test-header
    metrics:
    - name: shake_consistent
      help: Example of sub-level value scrapes from a json
      path: '{.consistent}'
      labels:
        start_time: '{.start_time}'
    - name: shake_total_entries_count
      type: object
      help: Example of sub-level value scrapes from a json
      path: '{.total_entries_count}'
      values:
        read_count: '{.read_count}'     # static value
        read_ops: '{.read_ops}' # dynamic value
        write_count: '{.write_count}'
        write_ops: '{.write_ops}'
    - name: shake_per_cmd_entries_count_restore
      type: object
      help: Example of sub-level value scrapes from a json
      path: "{.per_cmd_entries_count.RESTORE}"
      values:
        read_count: '{.read_count}'
        read_ops: '{.read_ops}'
        write_count: '{.write_count}'
        write_ops: '{.write_ops}'
    - name: shake_per_cmd_entries_script_load
      type: object
      help: Example of sub-level value scrapes from a json
      path: "{.per_cmd_entries_count.SCRIPT-LOAD}"
      values:
        read_count: '{.read_count}'
        read_ops: '{.read_ops}'
        write_count: '{.write_count}'
        write_ops: '{.write_ops}'
    - name: shake_reader
      type: object
      help: Example of sub-level value scrapes from a json
      path: "{.reader}"
      labels:
        address: '{.address}'          # dynamic label
        dir: '{.dir}'
        status: '{.status}'
      values:
        rdb_file_size_bytes: '{.rdb_file_size_bytes}'
        rdb_received_bytes: '{.rdb_received_bytes}'
        rdb_sent_bytes: '{.rdb_sent_bytes}'
        aof_received_offset: '{.aof_received_offset}'
        aof_sent_offset: '{.aof_sent_offset}'
        aof_received_bytes: '{.aof_received_bytes}'
    - name: shake_writer
      type: object
      help: Example of sub-level value scrapes from a json
      path: "{.writer}"
      labels:
        name: '{.name}'          # dynamic label
      values:
        unanswered_bytes: '{.unanswered_bytes}'
        unanswered_entries: '{.unanswered_entries}'
三.prometheus配置
1.prometheus.yml
global:
  scrape_interval: 15s
  evaluation_interval: 15s

scrape_configs:
  - job_name: json_exporter
    metrics_path: /probe
    file_sd_configs:
    - files:
      - 'redis-shake.json'
    relabel_configs:
      - source_labels: [__address__]
        target_label: __param_target
      - source_labels: [__param_target]
        target_label: instance
      - target_label: __address__
        replacement: 10.111.11.11:7979 # json-exporter地址
2.redis-shake.json
单独的文件配置可实现动态加载,同时可添加自定义的标签在文件中
[
# labels为自定义的标签,targets为部署各个redis-shake地址
{"labels": {"env-1":"团队1"},"targets": ["http://10.111.11.12:8888"]},
{"labels": {"env-1":"团队2"},"targets": ["http://10.111.11.12:8889"]},
{"labels": {"env-1":"团队3"},"targets": ["http://10.111.11.12:8890"]}
]
四.grafana
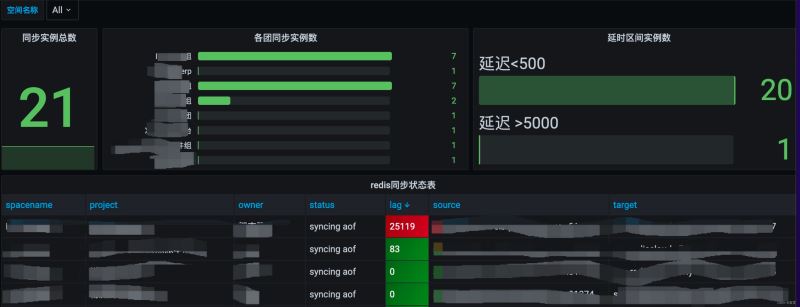
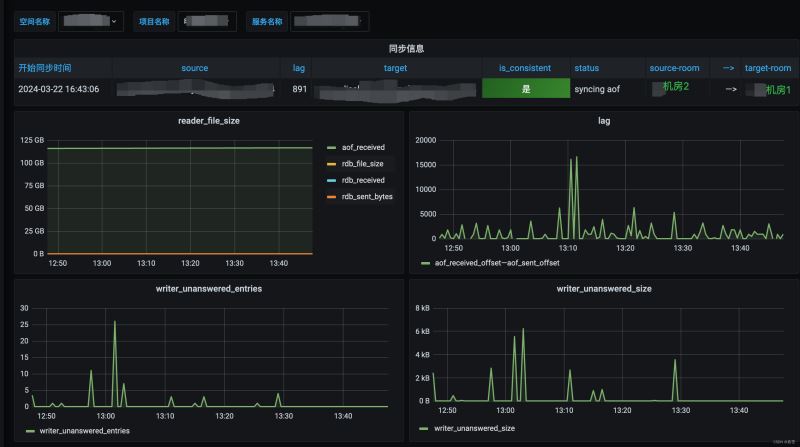
上边的都配置好,把自己的peometheus数据源添加到grafana中,就可以设置自己想要的监控界面了


到此这篇关于Redis shake实现可视化监控的示例代码的文章就介绍到这了,更多相关Redis shake可视化监控内容请搜索IT俱乐部以前的文章或继续浏览下面的相关文章希望大家以后多多支持IT俱乐部!

